HR KPIs analyze how efficiently an HR team is achieving its HR strategy goals. As human resource departments automate more tedious administrative tasks, they are increasingly able to take on a more strategic role in the company. Traditionally, KPIs have been used to guide and measure performance. HR teams are now leveraging these indicators to analyze data, formulate valuable insights, and plan for the future. Focusing on the right HR KPIs is essential to maximizing impact and position HR as a strategic player in your organization. In this article, we will define the 11 crucial HR key indicators that HR professionals can use to strengthen their strategy and grow their team and business.
Find out how to embed people analytics into your HR operations. Download our latest report.
What is a KPI?
💡 A Key Performance Indicator (KPI) is a metric that measures the performance of a particular activity or process. Generally, the objective of a KPI for HR is to analyze how effective a particular project, person, or action is in achieving your business goals. Therefore, KPIs help determine what actions the HR department has taken to accomplish its goal. This insight facilitates better decision-making and problem-solving.
For example, for email marketers, using the open rate of their newsletter is a KPI that measures engagement. The percentage (%) of individuals who open the newsletter will determine the relevance and quality of the content that you sent. And likewise, HR teams should tailor their KPIs to match their goals and ensure what they’re measuring can provide them with insightful data.
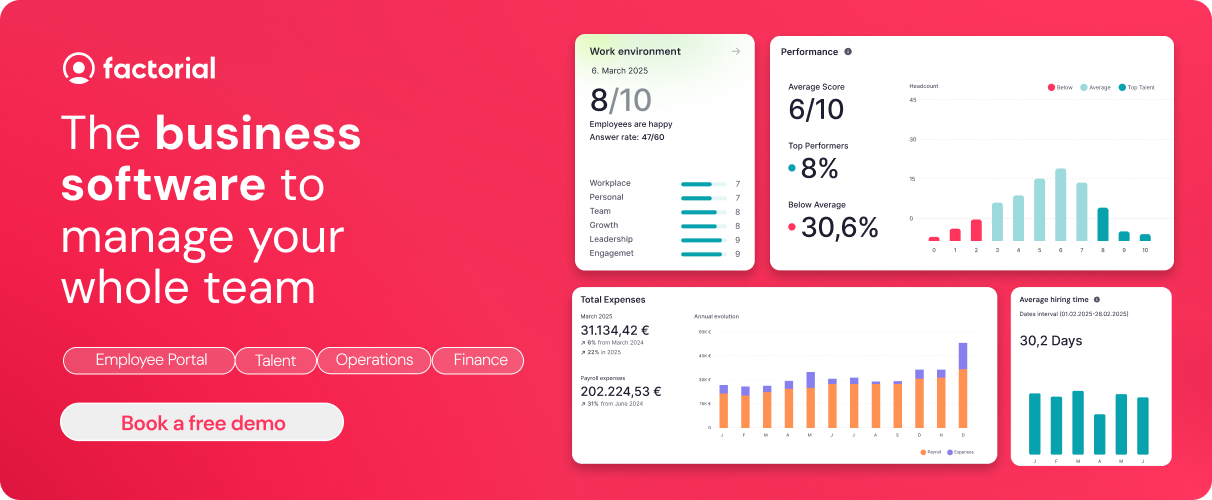
Upgrade your business with next-gen Business Management Software.👇
What are KPI reports?
💡 Organizations collect large amounts of data every day. Unfortunately, many organizations don’t leverage their data to uncover the real value. That’s where KPI reports come in. They are a strategic report to measure productivity, monitor trends, and identify any areas for improvement. A KPI report is a visual representation of KPIs, making complex data easy to analyze and interpret. This centralizes key information while providing stakeholders with valuable data to back up their decisions.
It’s also essential to recognize that not all data contributes to strategic goals, KPI reports help focus attention on the metrics that truly matter. For example, HR KPI reports enable managers to track performance, engagement, and other critical factors that drive organizational success.
| 🚀 Related: 7 Best HR Analytics & Reports Software to Keep Track of HR KPIs |
What are HR KPIs?
Human Resources key performance indicators (HR KPIs) are metrics used to measure how HR is aiding and contributing to the success of an organization. Essentially, HR KPIs analyze how efficient a company’s HR team is in accomplishing its HR strategy. Some KPIs that can be used by HR teams are:
- Absenteeism rates to measure employee satisfaction
- Overtime hours to understand the employee workload
- Time to hire to gauge if their recruitment process is effective
KPIs for HR: Metrics to Measure Success
In order to be successful, HR managers need to use HR KPIs that reflect the larger goals of the department and company. Further, they must be:
- Concrete: The KPI should be tangible and it should have a specific goal.
- Measurable: If you cannot measure the KPI, it isn’t a KPI.
- Reachable: Stay realistic when defining a KPI that will determine your success.
- Relevant: Monitor only the things that really matter, don’t waste time with indicators that do not contribute anything to your company.
11 HR KPI Examples
1. Turnover Rate
Turnover rate is the percentage of employees who leave the company during a given period. High turnover can disrupt company culture, lower morale, and reduce productivity.
How you calculate your turnover rate:
Turnover rate (%) = (Number of Leavers ÷ Average Number of Employees) × 100
With turnover rates up nearly 20% compared to pre-pandemic levels, tracking this KPI is essential. If rates are high, it may signal issues with compensation, workplace culture, or leadership – indicating the need for internal changes to improve retention. Beyond operational disruptions, having a high turnover rate is also costly. Monitoring this metric is a strategic way to manage your company expenses. As a reference, a turnover rate below 10% is the common benchmark.
Want to learn how to reduce turnover rates? Watch our comprehensive video about turnover rates below 👇
`2. Retention of talent
Retention of talent is closely related to the turnover rate. However, rather than measuring the number of employees who left, this KPI measures the number of employees who stayed, or were retained by the organization. Essentially, this metric is the percentage of employees who stay with the company over a specific period. While turnover looks at who leaves, retention measures who stays.
How you calculate retention of talent:
Retention rate (%) = (Remaining Headcount at End of Period ÷ Headcount at Start of Period) × 100
Understanding the average employee retention rate in an organization is important for workforce planning, recruitment, and overall business strategy. Retention rates may provide insight into other factors such as the remuneration rate or the labor climate. Maintaining a high retention is beneficial for your company as it reduces hiring costs and ensures business continuity. It also provides insight into how factors such as salary, benefits, and company culture influence loyalty. Ultimately, HR should investigate how salary, time off policies, or office climate impact retention.
See: Key HR Metrics: 12 Strategies to Boost Employee Retention
3. Duration in the position
Duration in the position measures the average length of time employees remain in the same role.
How you calculate duration in the position:
Average duration = (Sum of months employees stay in their role ÷ Total number of employees)
If employees remain in the same position for too long without promotion opportunities, they may look elsewhere. This KPI helps HR identify gaps in career development and progression. Learning and development opportunities provide companies with a skilled workforce while also enhancing their team’s employee satisfaction which leads to higher engagement and productivity levels.
4. Dismissal rate
The dismissal rate measures the percentage of employees terminations by the employer, excluding retirements or voluntary resignations.
How you calculate it:
Dismissal rate (%) = (Number of Employer-Initiated Terminations ÷ Average Number of Employees) × 100
High dismissal rates may point to poor hiring decisions, weak onboarding, or misaligned expectations. Monitoring this KPI helps HR refine recruitment and performance management processes. By identifying the root issue, HR teams implement new processes to combat high dismissal rates and improve their team’s stability and morale.
Related: Key HR Metrics: How to Learn from Your Involuntary Termination Rate
5. Absenteeism
Absenteeism is the percentage of work hours lost due to absences (sick leave, tardiness, unexcused absences).
How you calculate absenteeism:
Absenteeism rate (%) = (Total Hours of Absence ÷ Total Work Hours Available) × 100
Absenteeism directly impacts productivity and business costs. This metric is a key indicator that shows the impact of absences on the company’s costs. To prevent misuse of company money, it’s recommended to track your team’s absence rate. That way, HR teams are able to easily spot patterns and design preventive measures (e.g., welling programs or flexible policies).
6. Time to fill
Time to fill is the average time to replace an employee, from the time of announcement to when a new hire is onboarded.
How you calculate time to fill:
Time to fill = (Sum of days taken to fill roles ÷ Number of roles filled)
Long recruitment times increase costs and can stall operations leading to employee burnout, dissatisfaction, and increased workloads. Measuring this metric gives HR teams insights into how efficient or inefficient their recruitment strategy is. A shorter time to fill reflects a well organized hiring process and in turn, decreases any operational disruption that could have occurred.
7. Training participation
This metric tells you the extent to which employees engage in training, learning, and development programs.
How you calculate participation:
Training participation (%) = (Number of Employees Who Completed Training ÷ Total Employees) × 100
Training and L&D programs for employees boosts productivity, satisfaction, and retention. Tracking this KPI helps HR measure the effectiveness of L&D programs and ensure skill gaps are being addressed. Additionally, providing learning opportunities is an HR strategy to increase loyalty and employee satisfaction levels in the workplace.
See: How a Training Dashboard Can Help Employee L&D
8. Cost per hire
Cost per hire indicates the average cost of recruiting and onboarding a new employee, including advertising, recruiter fees, interview time, and training.
How you calculate cost per hire:
Cost per hire = (Total Recruitment & Onboarding Costs ÷ Number of Hires)
Recruitment can take up a significant part of the company budget. Monitoring this KPI helps HR optimize budgets, identify inefficiencies, and prove ROI on recruitment strategies. Once you know your cost per hire, you can forecast while taking into consideration the costs associated with talent acquisition.
See: Key HR Metrics: Analyzing Your Cost-Per-Hire
9. Employee productivity
Employee productivity is the efficiency of employees in achieving tasks and goals within their roles.
How you calculate employee productivity:
Productivity = (Output Produced ÷ Input of Work Hours)
This HR KPI reveals how effectively your workforce uses their time and skills. Tracking productivity helps HR fine-tune policies, optimize workloads, and improve overall performance. To understand employee productivity, HR should consider all the factors impacting employees’ productive output. This includes the time employees spend working, their performance or the quantity of product produced, and the quality of the product delivered. So employee productivity data should inform future office policies.
See: Key HR Metrics: Boost Employee Productivity
10. Accidents in the workplace
Employers must track the number of incidents or accidents that occur in the workplace over a period.
How you calculate accident rate:
Accident rate = (Number of Workplace Accidents ÷ Total Number of Employees) × 100
Monitoring safety incidents is vital to comply with regulations, ensure employee well-being, and reduce costly downtime or compensation claims. This HR KPI is particularly important for blue collar industries like construction or manufacturing. By measuring the number of accidents in the workplace, teams can implement policies to avoid future accidents.
11. Employee satisfaction
Employee satisfaction is a measurement of how content and engaged employees are with their work environment, policies, and benefits.
How you calculate employee satisfaction:
Employee satisfaction is often measured through surveys, eNPS (Employee Net Promoter Score), or pulse checks.
It’s important to note that employee satisfaction is dependent on a range of factors beyond financial benefits. These include a positive work-life balance, remote working and flexible working options, non-monetary benefits. High satisfaction leads to better retention, stronger performance, and a healthier company culture. Regularly tracking this HR KPI allows HR to address concerns proactively.
📌 Want to measure your employee satisfaction? Download Factorial’s free employee satisfaction survey.
HR KPI Software to Reach Your Goals
Workforce analytics is increasingly important for HR. Although your HR KPI data may not be up to date, Factorial can get you there – with the help of AI. Factorial is a business management software with HR reports and analytics capabilities. It generates personalized HR reports from data so you can get valuable HR KPI insights in an instant. With Factorial AI, your company’s data, including employee timesheets, recruitment length, job vacancies, and more are all summarized into an easy to read report. That way, you can focus on making strategic impact and enhancing your processes. Let Factorial take care of the reports for you so you can grow your people. Speak to a product specialist to see Factorial in action and understand how it can transform the way you approach HR KPIs.