DE&I is about more than just changing your mission statement. In this article, we address how organizations can track their progress toward DE&I goals using diversity metrics.
How do you know if something works if you can’t see the outcome? Metrics play a key role in helping HR professionals make more informed decisions about their workforce. And diversity metrics can help to improve DEI practices.
Diversity, Equity, and Inclusion (DEI) programs are often put into place in an attempt to reduce unconscious bias and workplace discrimination. However, according to the Harvard Business Review, the majority of diversity and inclusion programs are ineffective. In order to make DEI initiatives worthwhile, HR managers are using diversity metrics to target problems and get feedback.
So, how does HR make sure that they are on the path to reduce bias? Keep reading to find out.
- What are Diversity Metrics?
- How to Measure Diversity, Equity, and Inclusion
- What Diversity Metrics Should be Included?
- Diversity Dashboard Examples
- How to Use Metrics to Reach DEI Goals

What are Diversity Metrics?
Diversity metrics are the measurable numerical values that help HR to see workforce demographics and assess the efforts of the company towards inclusive practices. Like other metrics for HR, diversity metrics allow you to gain insight into your workforce and the overall health of the company.
How to Measure Diversity, Equity, and Inclusion
People are individuals, with individual differences and struggles, and HR KPIs do not always reflect these intricacies.
While approaching DEI in the workplace, it is important to think about a concept known as “intersectionality”. In short, intersectionality is about respecting the layered realities that people have. An intersectional model does not force people to fit into a single category.
For example, perhaps an employee is a middle-aged, female, immigrant who is also a mother. There may be several realities and biases that she faces, which aren’t necessarily reflected by a single KPI.
For this reason, and for many others, it is important to look at a variety of metrics to get the full picture. Every employee and every workplace is different. While creating diversity dashboards and HR reports, HR professionals should use both people analytics and workforce analytics to gain insight into their team. In order to see “the big picture”, human resources might consider customized HR reports to gain insight into things like gender parity and pay equity.
What Diversity Metrics to Include in Your Dashboard?
Knowing which metrics to include in your HR dashboard is crucial. The right metrics separate a successful DEI strategy from one that is ineffective.
To answer this question, HR professionals should look at their workforce and determine where there is room for improvement.
Is there an extreme gender imbalance in certain departments? Is the company dealing with age bias? Are certain populations unsatisfied with the company culture? Is there a large employee turnover?
In order to leverage KPIs to make substantial changes, HR should consider metrics that relate to hiring, promotion, employee satisfaction, and retention.
Hiring Metrics
According to a recent study of fortune 500 companies, black applicants experience systematic discrimination during the hiring cess. It was found that applicants with a traditionally “white name” were more likely to get a response, even if they lacked experience and credentials.
In order to ensure the best practices for hiring new employees, it is crucial to set up a hiring dashboard. There are several metrics that reflect inclusivity in the hiring process. HR professionals should especially consider the demographics of applicants and the demographics of those who receive job offers.
When comparing the two metrics, recruiters and hiring managers will be able to catch any bias that comes into play during the process of selection.
Next, ask: Is there a lot of diversity in the applicant pool? If not, it might be worthwhile to take a closer look at job descriptions and the way that they are advertised.
Do the tone and language of the job post exclude certain groups of applicants? Perhaps certain platforms would help to reach a more extensive audience.
Promotion Metrics
According to Pew Research, the percentage of fortune 500 female CEOs reached its peak of 7.4% in 2020. There were no black nor Hispanic females on the list. HR can stand for systemic change by paying attention to who gets a raise and why.
In order to work towards equity, HR professionals should keep an eye on metrics that show demographics for employees who hold executive positions.
Employee Satisfaction
Understandably, employee satisfaction directly ties to employees’ comfort levels while at work. It reflects their level of acceptance in their position and integration in the company culture. Although it is often thought of as a qualitative marker, there are ways to measure and incorporate employee satisfaction as part of your HR dashboard.
If satisfaction levels are low, HR may want to take a closer look to see if inclusive practices are taking place. In order to do this, they should ask themselves: Are microaggressions common? Do employees feel supported if they are part of marginalized groups? Is there an adequate amount of employee engagement, or are populations cut out of the decision-making process?
Retention Rates
Like employee satisfaction, retention metrics like the turnover rate and the attrition rate can reveal workplace toxicity and frustration. If there is a high turnover rate amongst a specific demographic, it is a red flag that signals other issues and destructive patterns in the workplace.
In order to reduce involuntary terminations, Human resources should try to find out the specific causes of turnover. Often, employees leave due to poor compensation, lack of growth opportunities, bad management practices, and toxic work environments.
Diversity Dashboard Examples
Using Factorial’s custom HR reports tools, it is possible to create custom dashboards that help support DEI initiatives. Here are some examples of custom dashboards that measure gender diversity in the workplace.
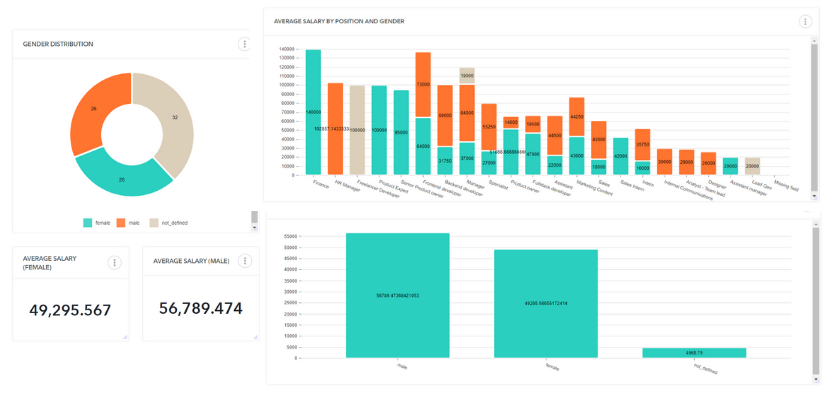
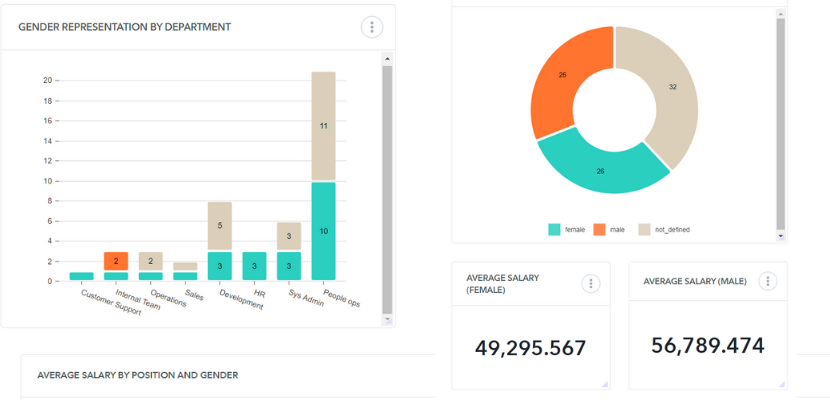
As seen in the photos, a combination of different reports is necessary to have a more in-depth overview of the effectiveness of DEI efforts.
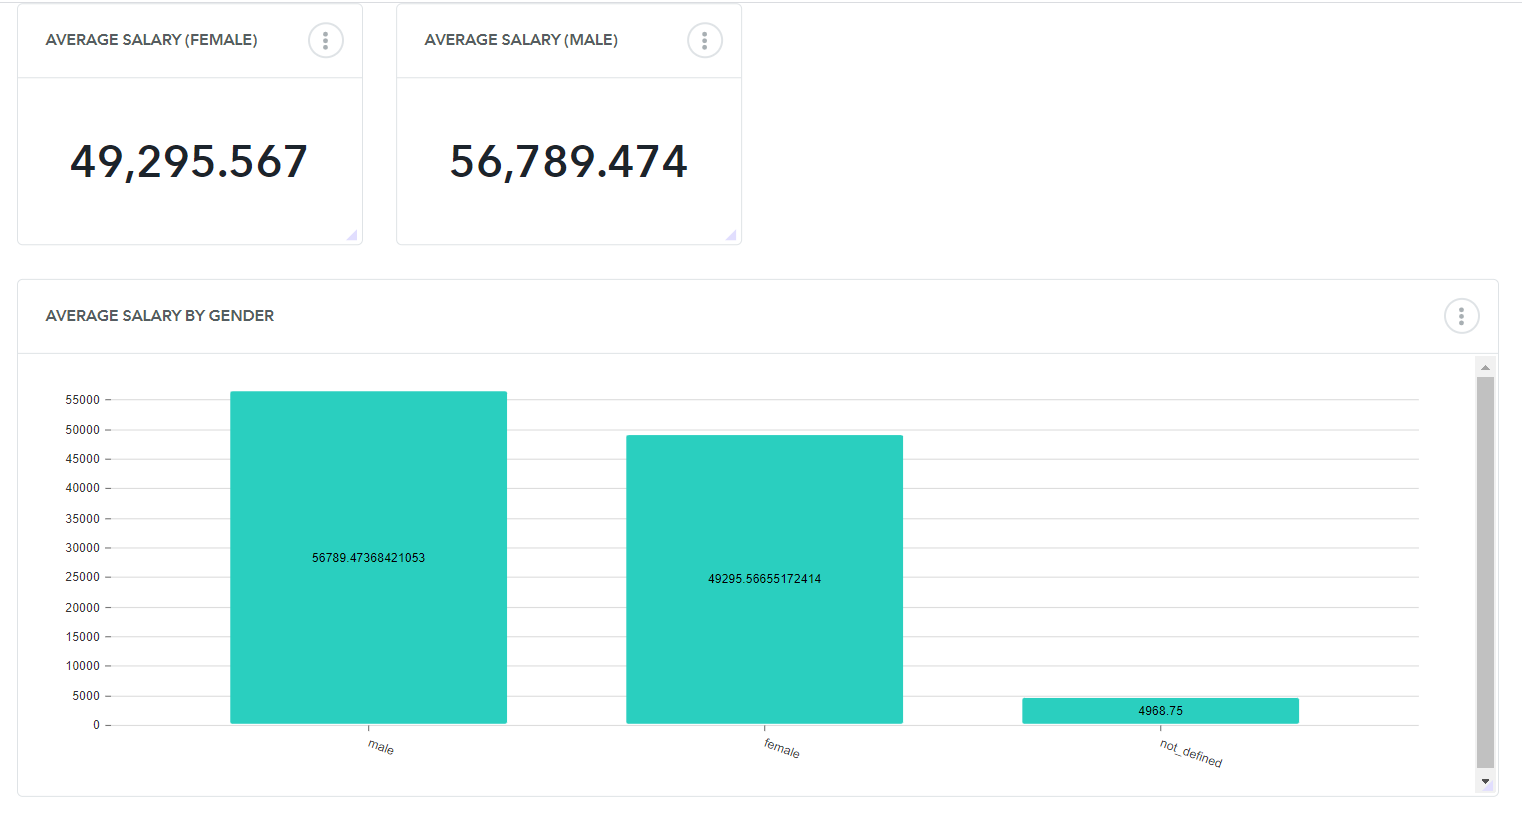
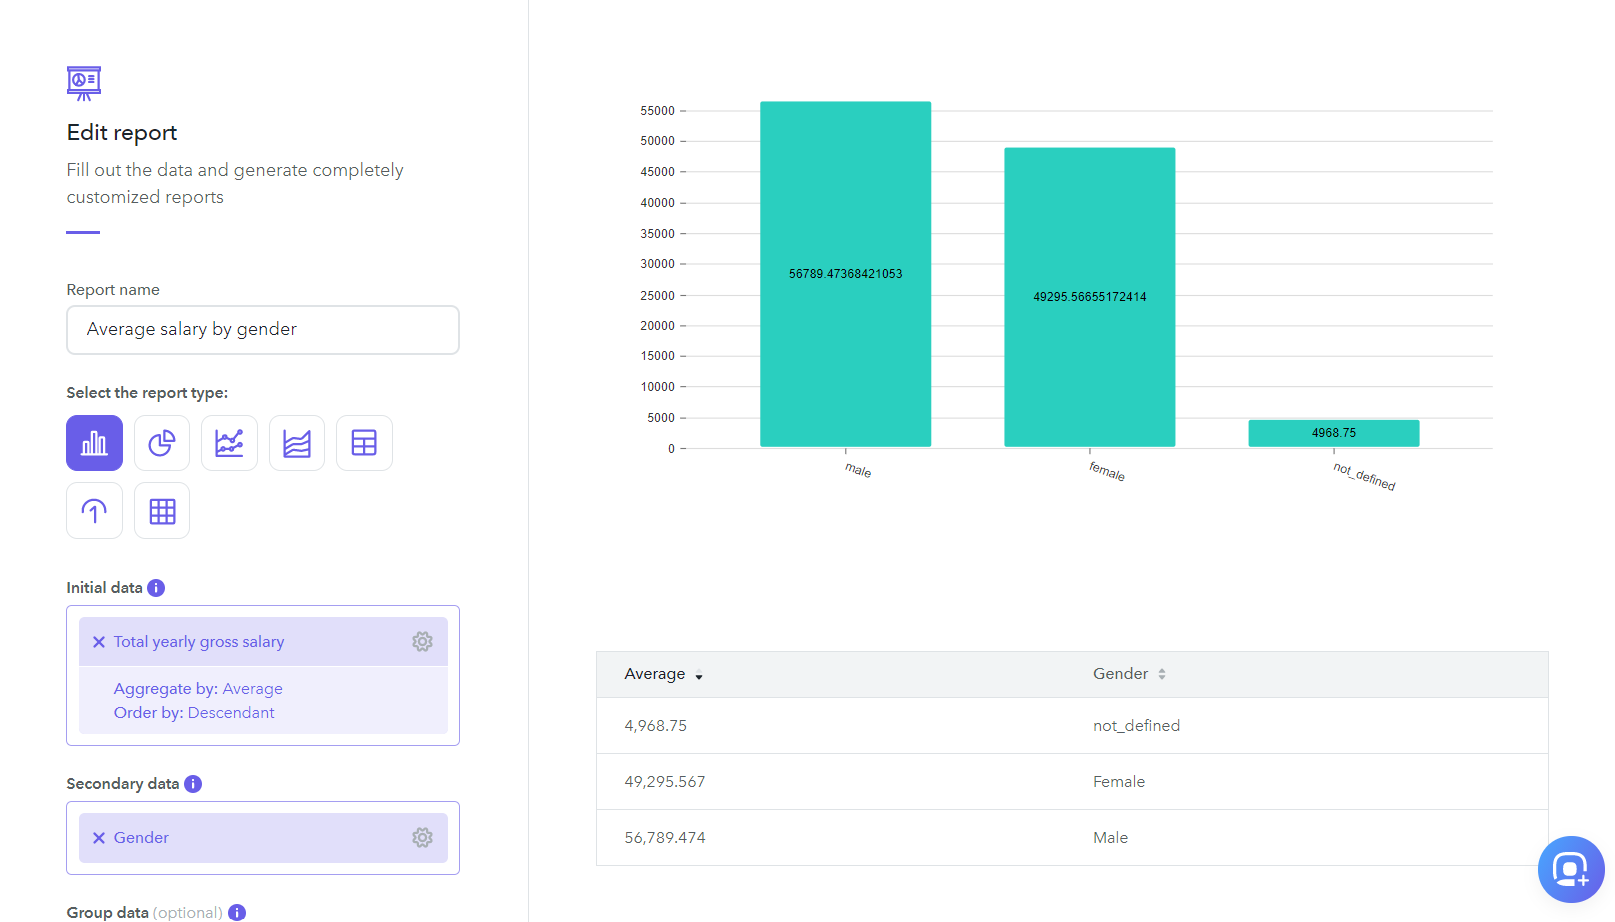
Factorial uses an intuitive and easy-to-use interface, meaning that creating reports like these is easy breezy. Here’s a report that shows the average salary by gender.
And here is how it is managed and edited using the factorial interface. Just enter the employee data and let the software do the work.
Tools to Reach DEI Goals
As stated before, metrics do not reveal all of the nuances that are part of ensuring a diverse and inclusive workplace. But, they can help HR to visualize disproportionate representation and detect exclusive practices and problems.
The goal is always to help your workforce feel empowered and capable of success. By using metrics to keep track of diversity and inclusion initiatives, HR can find better ways to create a supportive and inclusive workforce.
In order to keep track of diversity and inclusion metrics with ease, HR professionals should consider automated HR reports. Reports that display demographic data in a way that is intuitive and easy to understand will ultimately save you time and money.
With HR software, you can create custom HR reports and more. Here at Factorial HR, we work to streamline HR processes, giving human resources professionals more time to dedicate to what really matters.