Understanding employee job satisfaction is a crucial aspect of creating a productive and harmonious work environment. This collection of statistics sheds light on various facets of job satisfaction, from the impact of flexible work arrangements and employee benefits to the significance of company culture. Read this list to gain a better understanding of the intricacies of job satisfaction in today’s professional landscape and identify areas in your company policies that need work.
TABLE OF CONTENTS
Employee Satisfaction Statistics
How to gain insight through company metrics
Create Custom HR Reports 🚀
Employee Satisfaction Statistics
1. Overall Job Satisfaction is at an all-time high in the US
This report indicates that job satisfaction among American workers has reached an all-time high in 2022, continuing a steady upward trend. Job satisfaction in the United States increased to 62.3% in 2022, marking the highest level recorded since the survey began in 1987. This rise in satisfaction follows consecutive annual increases, reflecting a long-term trend.
The reasons for improved satisfaction are many
The primary drivers of improved job satisfaction in 2022 were non-compensation factors such as work-life balance, workload, and performance review processes, which saw significant gains over the previous year.
2. However, there is a large gender gap in job satisfaction
Women report lower satisfaction than men across various job satisfaction categories. Notable gaps were observed in areas such as sick day policies, bonus plans, mental health benefit policies, and communication channels.
3. 41% of black workers report experiencing discrimination in the workplace
Black workers are most likely to report experiencing workplace discrimination due to their race or ethnicity, with 41% reporting such incidents. White workers are less likely to experience racial discrimination (8%).
| 💡 Black workers are more likely to experience workplace discrimination based on their race or ethnicity. This highlights ongoing disparities in the workplace and the need for efforts to combat racial discrimination and promote inclusivity. |

4. Older workers are more satisfied with their jobs
Older workers, aged 65 and older, are the most satisfied with their jobs, with two-thirds extremely or very satisfied.
Job satisfaction decreases with younger age groups, with only 44% of those aged 18 to 29 expressing high job satisfaction.
| 💡 Older workers, especially those aged 65 and older, tend to express higher job satisfaction compared to younger workers. This could be due to factors such as greater job stability, experience, and a potentially more positive outlook on their careers. |
5. Workers who earn more are more satisfied with their jobs
Workers with higher incomes report higher job satisfaction across various aspects, such as job overall, benefits, training opportunities, pay, and promotion prospects.
Upper-income workers are more likely to feel their contributions are valued and that their employer cares about their well-being.
| 💡 Job satisfaction tends to increase with higher income levels. Workers with higher incomes often report greater satisfaction with various aspects of their jobs, indicating a link between financial well-being and overall job contentment. Read our guide on how to conduct a pay equity analysis. |
6. Engagement and Culture, as well as Work-Life Balance are the leading factors to someone leaving their job
In 2022, “Pay/Benefits” was the most common single reason for employees leaving their jobs, though it constituted only 20% of primary reasons, signaling the need to address a wider array of employee needs. A broader categorization revealed that “Engagement and Culture” accounted for 40% of reasons for departures, with “Wellbeing and Work-Life Balance” at 26%. These two themes collectively comprised 66% of the total reasons employees left their jobs, underscoring the significance of addressing engagement, culture, and work-life balance to reduce employee turnover.
7. 39% of workers identify with their job or career
About 39% of workers consider their job or career to be extremely or very important to their overall identity.
Workers with a postgraduate degree are most likely to see their job as central to their identity (53%).
| 💡 A significant portion of workers see their job or career as a crucial part of their identity. Those with advanced degrees are more likely to tie their identity to their work, possibly because of the expertise and educational investment associated with their careers. Check out our guide on training programs and how to conduct a training needs analysis. |
8. Flexible work arrangements contributed to job satisfaction
Employees with hybrid work arrangements demonstrated higher job satisfaction compared to fully remote or fully on-premises workers. Hybrid workers were slightly less satisfied with job security but showed higher satisfaction regarding pay, benefits, and training opportunities.
| 💡 Implementing flex hours in the workplace can offer a range of advantages for both employees and employers. A flexible hours policy that enhances work-life balance, boosts productivity, and supports employee satisfaction. Read our guide to understand how to implement flex work schedules. |
9. Workplace culture plays a significant role in employee retention
Besides competitive pay, factors that most influence employee retention include organizational culture, quality of leadership, and work-life balance. These retention factors align with the primary drivers of overall job satisfaction, emphasizing the importance of workplace culture.
10. A vast amount of workers have access to some sort of employer-sponsored benefit
The majority of workers have access to employer-sponsored benefits such as paid time off, health insurance, and retirement programs.
Access to these benefits varies by income, with lower-income workers less likely to have access.
| 💡 Access to employer-sponsored benefits varies based on income, with lower-income workers less likely to have access. This disparity may impact the overall well-being of lower-income employees who may not have access to essential benefits. |
11. Most workers find it is important to have access to benefits such as PTO and health insurance
Most workers prioritize having a job with paid time off for vacations, doctor’s appointments, and minor illnesses.
Health insurance is the most important benefit for workers, followed by retirement programs.
| 💡 Workers prioritize different job benefits, with paid time off and health insurance being highly valued. Health insurance, in particular, is regarded as the most crucial benefit, emphasizing the significance of healthcare coverage for employees. |
12. Most workers say they are satisfied with the number of hours they work in a typical week
Most workers (66%) feel they work about the right number of hours each week.
Lower-income workers are more likely to report working too few hours, while middle- and upper-income workers more often feel they work too many hours.
| 💡 Most workers feel that they work an appropriate number of hours each week. Lower-income workers are more likely to feel they work too few hours, while middle- and upper-income workers more frequently express concerns about working too many hours. Read our article on all the different types of shift schedules available to employees. |
13. 46% of workers don’t take all the time off work that is offered
Nearly half of workers don’t take all the paid time off offered by their employers.
Reasons for not taking time off include feeling they don’t need more time off, concerns about falling behind at work, and not wanting to burden co-workers.
| 💡 A substantial number of workers do not use all the paid time off they are offered by their employers. Reasons vary, including not feeling the need for more time off, concerns about falling behind at work, and reluctance to inconvenience co-workers. Often, the issue with PTO is the uncomfortable process of requesting time off. Check out our article on how you can simplify time off request processes at your company. |
These findings show that we need to make workplaces fair and satisfying for everyone. They reveal differences in job satisfaction, experiences at work, and benefits among different groups. They also help us understand how age, income, identity, workplace fairness, benefits, and job satisfaction are connected for American workers.

Gain insights into your workforce through company metrics
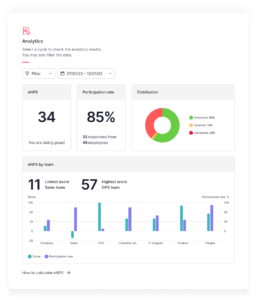
Factorial’s Analytics & Reporting feature, Insights, offers real-time, non-editable widgets with essential HR and business metrics.
🚀 These widgets cover:
- Headcount, Joiners, and Leavers Evolution.
- Turnover and Retention Rates.
- Employee demographics by legal entity, gender, and team.
- Average employee age and age group distribution.
- Promotion rates by team.
For a free tool to test while you wait for the demo, download our employee satisfaction survey.

More about Factorial’s Reporting features
Factorial gives you the power to create and analyze employee surveys. You can either use pre-designed survey templates to launch surveys quickly or create custom surveys tailored to your specific needs. This feature enables you to gain a better understanding of your employees’ opinions and feedback.
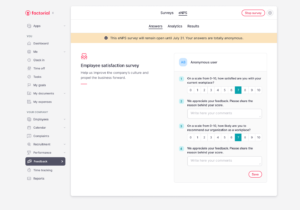
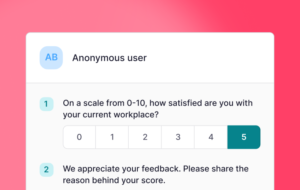
The raw results table in Insights provides a comprehensive overview of all the answers from every participant in the survey. If you prefer a more visual representation, you can access a summary with graphs to better interpret the survey results. Moreover, Insights allows you to create anonymous surveys, fostering an environment where employees feel comfortable sharing their thoughts and opinions openly.
With Factorial’s Analytics & Reporting feature, you can effortlessly monitor, analyze, and act on critical HR and business operation metrics, ensuring that you have the insights needed to make data-driven decisions and drive your organization’s success.
Factorial offers a 14-day free trial. Sign up now to see the HR software in action for yourself! Book a demo call with one of our specialists to have all of your questions answered – signing up is easy!