Employee learning and development is an investment. And like any investment, it is important for it to be effective. Using a training dashboard not only improves performance and profits but can lead to increased retention and engagement rates, and decreased turnover rates.
Organizations all around the world are beginning to realize the importance of L&D programs. For example, Amazon has recently announced that it is investing $1.2 billion in education and skills training for its front-line employees. For training programs to be truly effective, though, people teams need to have access to employee progress so that L&D can be tracked and analyzed.
Key Highlights
- A training dashboard is a data visualization tool that centralizes learning and development (L&D) metrics to track program effectiveness, employee progress, and ROI.
- Companies that invest in regular employee training enjoy a 24% higher profit margin on average compared to those who spend less on L&D, as noted by the Association for Talent Development.
In this post, you’ll find what you need to know about training dashboards, training metrics, and tools for custom HR reports.

Table of Contents
- What is a Training Dashboard?
- Why are Training Metrics Important?
- What are Some Metrics for Evaluating Training and Development?
- 4 Training Metrics to Include in Your DashboardWhat Are the 4 Essential Metrics for a Training Dashboard?
- How to Gather Data for an Employee Training Dashboard
- Training Dashboard Examples
- Tools to Create Custom HR Dashboards and ReportsWhat Tools Can Create Custom HR Dashboards and Reports?
What is a Training Dashboard?
An employee training dashboard is a powerful L&D tool to help you track and analyze your learning metrics. Essentially, it is a centralized interface where you can see a visualization of all your learning data and metrics and monitor the progress of training and the achievement of goals.
It can help you establish how well your employees understand what training is available, how much they know about it, and the impact training is having on employee performance.
A training dashboard usually includes valuable training metrics like:
- Which training sessions have been completed
- How employees consume different types of L&D content
- Courses that have been taken more than once
- An evaluation of the success of a training program
- The training effectiveness of a program
- The alignment of training with organizational goals
- An evaluation of the different components of a training program
Why are Training Metrics Important?
Training metrics can be a valuable tool for HR reporting and people analytics. They are important because they can help you ensure that the training you provide is engaging and contributes to the goals and KPIs of your organization.
They can also help you evaluate the effectiveness of your courses to determine howthey improve employee performance. The third major benefit is that they can help you determine which training opportunities are creating value for your company so that data-driven decisions can be made to improve the learning process.
In other words, training metrics are a way of quantifying the results of your training and development programs. They can help you determine if your L&D programs are successful, if they help your employees achieve your business goals, and if they are worth the investment.
What are Some Metrics for Evaluating Training and Development?
There are a number of metrics that can be used for evaluating training and development. The training metrics you include in your training dashboard will largely depend on your industry and business objectives.
Generally speaking, though, the following HR metrics can provide you with valuable data:
- The number of employees who successfully complete training
- Pass/fail rate of training courses
- Assessment scores
- Impact of training solutions on KPIs
- Training cost per employee
- Labor costs of training vs ROI
- Learner engagement and satisfaction
- Operational efficiency
- Course enrollment data
- Course completion rates
- Employee performance post-training
What Are the 4 Essential Metrics for a Training Dashboard?
Regardless of your business objectives, the following 4 training metrics should be included in your training dashboard:
- Participation Rates: These give you great insight into the overall engagement of your employees. If participation rates are low, then you should re-evaluate how you are promoting your training opportunities. It might be worth reminding your staff of the importance of regularly checking into their employee training dashboard.
- Completion Rates: These stats can help you evaluate the quality of your training materials. If a high number of employees are failing to complete a course, then it is probablydue to an issue with the quality of your content. You could use additional metrics and trackers to determine if there is a specific point where most people exit a course.
- Pass Rate: It’s all good and well ensuring that your employees complete a course, but if your pass rates are low then it suggests that they may not be understanding your training materials. This could suggest that assessments are not aligning with learning objectives, or the standard is too high.
- Alignment with business goals: The final metric worth including is whether or not learning and development aligns with your business goals and KPIs. This is vital, as if training is not improving overall employee performance, then it is a waste of money.
Beyond these, consider adding metrics that measure the direct business impact. For instance, a Gallup analysis shows that business units with highly engaged employees see a 23% difference in profitability. Correlating training completion with engagement scores can provide powerful insights into your L&D programs’ financial and cultural ROI.
📌 Ready to customize your own training dashboard? Use this free employee training template to get started!
How to Gather Data for an Employee Training Dashboard
The data you choose to collect will depend on your KPIs and the workforce analytics you want to improve. You also need to consider who will be using the training dashboard. Will it be used by managers only or will all employees have access?
Once you’ve decided what data you will be gathering, how it aligns with your business objectives, and your hr benchmarking strategy, you need to work out how you are going to actually collect your data. There are a couple of options here.
A common starting point is a training tracker in Excel or Google Sheets. Templates are used to record information like your list of courses, assessment scores, and employee details. While these can record basic information like course lists and assessment scores, they lack automation and scalability. Administrative professionals spend a significant portion of their time on data entry, a task prone to human error, especially in spreadsheets or documents.
The downside is that manual tracking leaves you wide open to human error, and you are likely to miss out on valuable training metrics, decreasing the value of your training dashboard. The same is true for absence tracking, which is why many companies adopt an HR leave management system alongside training tools to centralize attendance, leave, and learning data in one place.
Gathering data while tracking employee training
The best solution to track employee training? Invest in a Training Management System to centralize, assess, and monitor progress. A training management system is primarily used for planning and monitoring the training courses in your company, centralizing all your training into a user-friendly platform, tracking employee progress, training expenses, and creating personalized reports. The primary benefit of a Training Management System (TMS) is its ability to reduce administrative work, which increases efficiency, consistency, and scalability. A report from the Society for Human Resource Management (SHRM) indicates that HR automation can reduce administrative tasks by up to 40%, freeing up L&D teams to focus on strategic initiatives rather than manual data tracking.
💡 Check out how Factorial’s Training Management System can automate this process for you! Click below to take a tour of the platform
Training Dashboard Examples
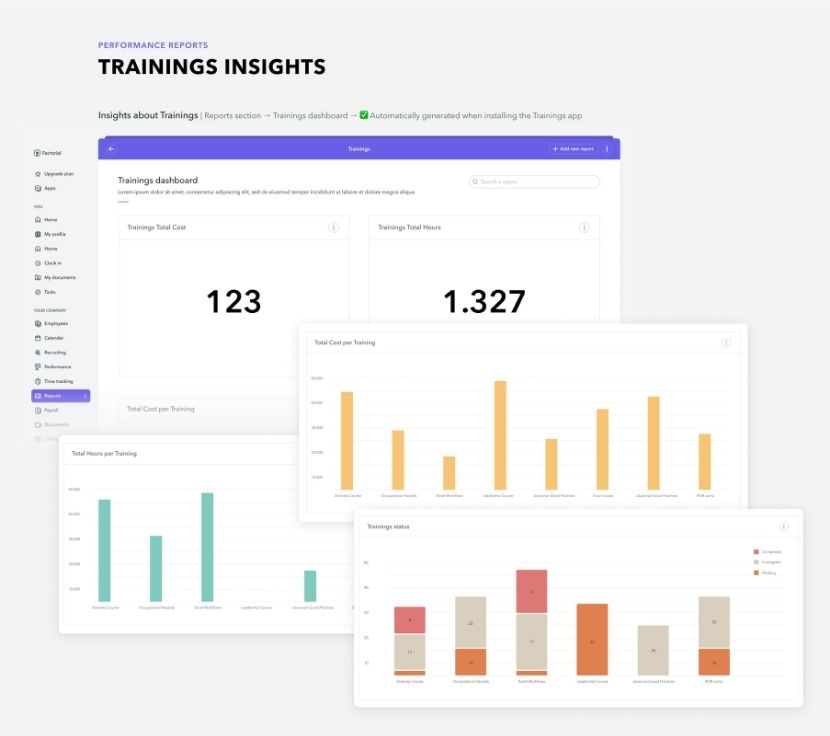
Here are a couple of examples of a training dashboard to help illustrate some of the benefits. These images demonstrate how your HR team can use training metrics to create custom reports that measure employee data.
On the following interface, you can clearly see a snapshot of the total cost of training and total hours spent on training:
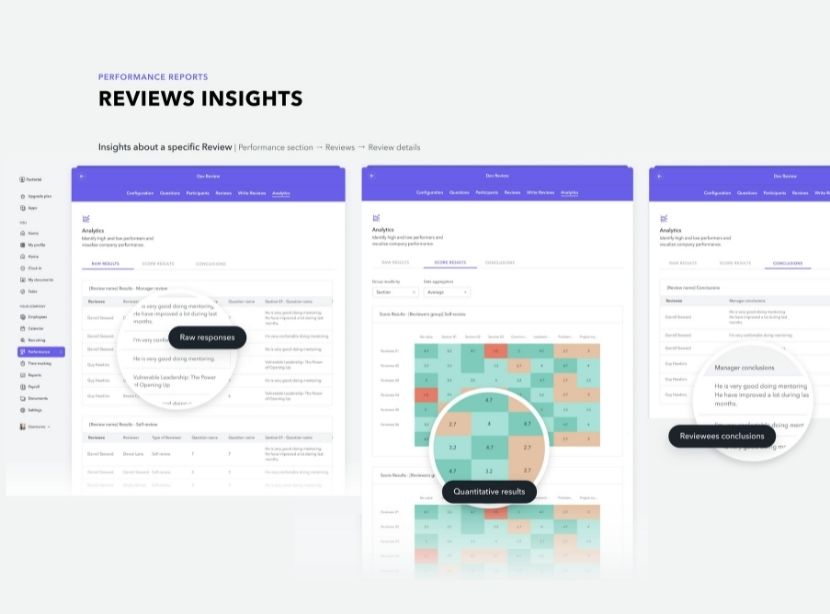
And here, you can see a review of all training insights, including quantitative results, raw responses, and reviewee conclusions:
By analyzing these stats, you get a clear image of the impact of your learning and development programs and the value that your organization gets from its training investment.
What Tools Can Create Custom HR Dashboards and Reports?
We’ve seen what a training dashboard is, and why training metrics are so important for your business. We’ve also seen what data you should gather for your employee training dashboard.
This leaves one all-important question: how do you create custom HR dashboards and reports?
Software like Factorial’s all-in-one HR software solution allows you to create custom dashboards and HR reports for all your company’s needs. With Factorial’s simple software solution for training management, you can:
- Plan and monitor the training sessions of your company
- Track training courses and employee development
- Track training costs and employee progress
- See who has completed a course and who is still in progress
- Follow up on employee training with surveys to analyze development
- Design a training system adapted to suit your needs and those of your employees
- Personalize information for each employee
- use data to set employee goals and support development
You can also use Factorial’s HR software to create other dashboards, too:
- Dashboards with employee performance metrics to measure the goals, reviews, and accomplishments of your workforce. Suggested HR reports include employee appraisals, employee satisfaction ratings, and employee goal completion.
- A hiring dashboard to help you to identify workplace gaps, measure hiring expenses, and pinpoint features of successful candidates.
- A diversity dashboard to help you track diversity metrics. You can use the dashboard to visualize and manage workforce demographics, and improve workplace inclusivity efforts and pay equality.
- A leave management dashboard to help you keep track of attendance and absences and keep your finger on the pulse of the mental and physical health of your workforce.
Best Practices for an Effective Training Dashboard
To maximize the value of your training dashboard, it’s crucial to follow established best practices for design and implementation. A well-designed dashboard not only presents data but tells a clear story about your L&D efforts.
- Define Clear Objectives: Before building, identify the key questions you need to answer. Are you focused on compliance, skill gaps, or engagement? Each goal requires different metrics.
- Know Your Audience: A dashboard for C-level executives should highlight ROI and business impact, while one for L&D managers should focus on operational metrics like course completion and learner feedback.
- Prioritize Data Visualization: Use charts and graphs that are easy to interpret. For example, use line charts to show trends over time (e.g., skill improvement) and bar charts to compare groups (e.g., participation by department).
- Ensure Data Integrity: Your dashboard is only as good as its data. Automate data collection where possible using an integrated system to prevent manual entry errors and ensure information is up-to-date.
- Make it Actionable: Each visualization should lead to a potential action. If you see low completion rates for a specific course, the next step should be to investigate the course content or delivery method.
If you’re ready to move away from a manual employee training template and start optimizing your workflows to free up your time, check out Factorial. An all-in-one platform that offers an easy-to-use training dashboard as well as LMS (Learning Management System) features so you can track your team’s success while assigning them courses from the same platform.
FAQ
What is a training dashboard?
A training dashboard is a centralized tool that visually displays key learning metrics like completion rates and assessment scores. It helps HR teams monitor training progress, evaluate program effectiveness, and make data-driven decisions to improve learning and development strategies.
What are the 4 types of dashboards?
The four main types of dashboards are: operational, for tracking real-time activities; strategic, for monitoring long-term goals; analytical, for understanding trends and causes; and tactical, for evaluating short-term team performance against specific objectives.
What is the 5-second rule for dashboards?
The 5-second rule states that a user should be able to understand the key information and required actions within five seconds of viewing a dashboard. This principle encourages a clear visual hierarchy and the prioritization of the most critical metrics.